PHM11 Data Challenge – Condition Monitoring of Anemometers
Introduction
Cup anemometers, based on the design of Dr. John Robinson, have been used to measured wind speed since 1846. The modern, 3 cup anemometer (the standard for wind resource assessment), was developed by John Patterson in 1926. Modern commercial anemometers have a linear measurement range of 0.3 to 75 m/s with a measurement uncertainty of less than 1%. The accuracy of these sensors is, in part, due to the health of the bearings supporting the cup shaft.
The three cup anemometer is the industry standard for wind resource assessment studies. A wind resources assessment is the first step in the development of the wind farm. They are used by wind power developers to estimate the future energy production of the proposed site. Accurate wind measurements feed a number of calculations, such as:
- Correlation between long term weather stations and on site meteorological towers. On site meteorological tower collect data for 1 year. This sort term data is correlated with longer term weather station to adjust long term estimate of wind speed.
- Vertical shear extrapolation to wind turbine hub height. Many meteorological towers only go to 60 meters, which typical wind turbine hub height is 80 or more meters. The power law and log law vertical shear profiles model are used to extrapolating measured wind speed to hub height.
- Modeling of complex terrain across a site. Wind speeds are relatively local phenomena. Multiple meteorological mast installation are used to drive linear or computational fluid dynamics model for a site to help minimum turbine wake and maximize power production.
All of these models are then used to calculate the net energy production of the wind farm. There are bounds on error which are used to evaluate the risk of the investment, which can affect the bond rating and financing of the site. A damaged or out of tolerance anemometer will affect these models, and the estimated energy production of a site. The inability to detect bad anemometers can dramatically affect estimated return on investment. For example, Figure 1 shows how 2% error in an estimate of average annual wind speed can result in a 6% difference in power production, which directly affects return on investment.
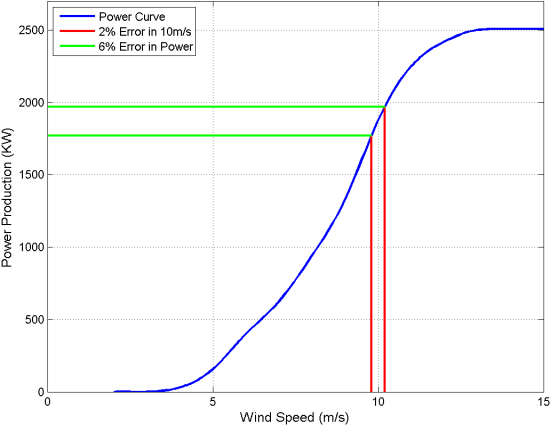
Figure 1. Power production curve for a typical large wind turbine, showing the effect of error in wind speed measurement on estimated power production.
Meteorological Tower Setup
The challenge problem consists of data from 50 or 60 meter towers. Each tower has a number of anemometers, a weather vane, and a temperature sensor. Each sensor measure data over a 10 minute period and reports the average, standard deviation, minimum and maximum value over that 10 minute period. Typically, there is a pair of anemometers at the top two levels (e.g. 59m and 49m on a 60m tower), then single or paired anemometers at 30m and/or 10m.
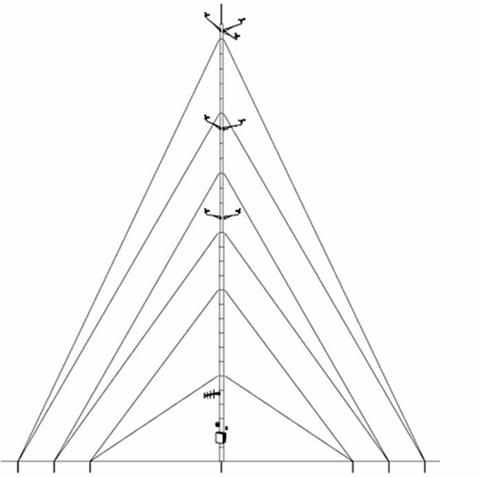
Figure 2. Example 60m tower with three sensor locations.
Figure 2 demonstrates a 60m tower with a power of anemometers and a wind vane at 59 meters, and a pair of anemometers at 49 and 39 meters, respectively. The anemometers are mounted 90 degrees relative to each other. This done because the wind is disturbed by the tower itself, even though the sensor is mounted 10 ft outboard of the tower (Figure 3).
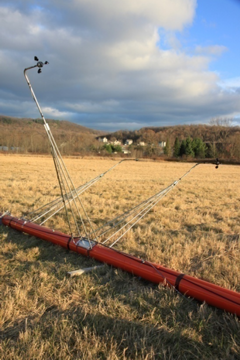
Figure 3. Relative position of sensors on a tower.
The Challenge Problem
There are two types of data for the challenge problem: paired anemometer data at the same height, and an array of anemometers are different heights. The goal of the problem is to determine if 1 or more of the anemometers exhibit excessive error due to damage or wear. “Excessive” means that the measurements show more than 2% error. This could be due to wear on the bearings, a failed shaft, or a missing cup. However, there are cases where the anemometers are not measuring correctly, for example, due to icing. When icing occurs, the anemometer is frozen or runs slow. This is not considered an error.