PHM Data Challenge
Call for Participation
 Click image above to download pdf |
The PHM Data Challenge is a competition open to all potential conference attendees. This year the challenge is focused on predicting faults in an ion mill etching tool. Participants will be scored based on their ability to successfully predict in advance when faults occur.
This is a fully open competition in which collaboration is encouraged. The teams may be composed of any combination of students, researchers, and industry professionals. The results will be evaluated by the Data Challenge Committee and all teams will be ranked. The top three scoring teams will be invited to present at a special session of the PHM conference and will be recognized at the Conference banquet event (scheduled for the evening of Wednesday, September 26th). Data Challenge Chairs (data@phmconference.org) |
Teams
Collaboration is encouraged and teams may be comprised of one or more students and professionals. The teams judged to have the first, second, and third best scores will be awarded prizes of $600, $400, and $200, respectively, contingent upon:
- Having at least one member of the team register and attend the PHM 2018 Conference.
- Submitting a peer-reviewed conference paper. Submission of the data challenge special session papers is outside the regular paper submission process and follows its own modified schedule.
- Presenting the analysis results and technique employed at a special session within the Conference program.
The organizers of the competition reserve the right to both modify these rules and disqualify any team for any efforts it deems inconsistent with fair and open practices. In addition, the top entries will also be encouraged to submit a journal-quality paper to the International Journal of Prognostics and Health Management (ijPHM).
Data Challenge Registration
Teams may register by contacting the Competition organizers (emails above) with their name(s), affiliation, and a team alias under which the scores would be posted. Please note: In the spirit of fair competition, we allow only one account per team. Please do not register multiple times under different user names, under fictitious names, or using anonymous accounts. Competition organizers reserve the right to delete multiple entries from the same person (or team) and/or to disqualify those who are trying to “game” the system or using fictitious identities.
Key PHM Data Challenge Dates
PHM Conference DatesSeptember 24-27, 2018
| Key Dates | |
|---|---|
| Competition Open | April 27, 2018 |
| Training Data Posted and Scoring Website Open | April 27, 2018 |
| Final Validation Set Posted | August 5, 2018 |
| Competition Closed | August 12, 2018 (12:00 pm PST) |
| Preliminary Winners Announced | August 19, 2018 |
| Winners Announced | September 2, 2018 |
| Final Papers Due, Winners Announced | September 16, 2018 |
System Description
This year’s data challenge examines the fault behavior of an ion mill etch tool used in a wafer manufacturing process (see references at the end of this document). An ion mill etching tool is shown in Figure 1. The process of ion mill etching typically consists of the following steps:
- Inserting a wafer into the mill
- Configure wafer settings (rotation speed, angles, beam current / voltages, etc.)
- Processing the wafer for a set amount of time
- Repeat 2 or 3 for different steps of recipe
- Remove wafer from mill
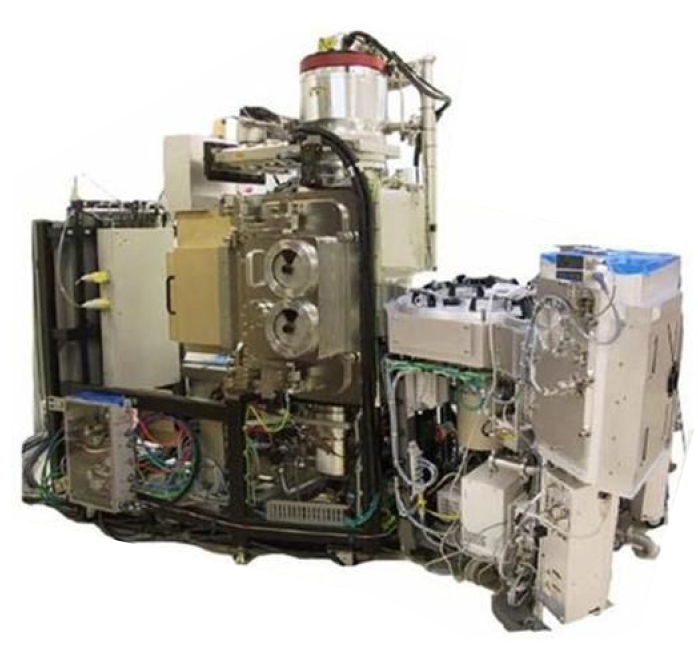
Figure 1. An Ion Mill Etching System.
An ion source generates ions that are accelerated through an electric field using a series of grids set at specific voltages. This creates an ion beam that travels and eventually strikes the wafer surface. Material is removed from the wafer when ions hit the wafer surface. The wafer is placed on a rotating fixture that can be tilted at different angles facing the incoming ion beam. The wafer can be shielded from the ion beam until ready for milling operation to commence using a shutter mechanism as shown in Figure 2. A Particle Beam Neutralizer (PBN) control system influences the ion beam shape / ion distribution as it travels to the wafer surface.
The wafer is cooled by a helium / water system called flowcool. The cooling system passes helium gas behind the wafer at a specified flow rate. The helium gas is indirectly cooled by a water system. The wafer and fixture o-ring separates the flowcool gas from the ion mill vacuum chamber.
Many different failure mechanisms can be present in this system including leaks between flowcool and ion mill chambers, electric grid wear, ion chamber wear, etc. It would be beneficial to predict where and when these failures occur and schedule downtime of these ion mills for maintenance operations.
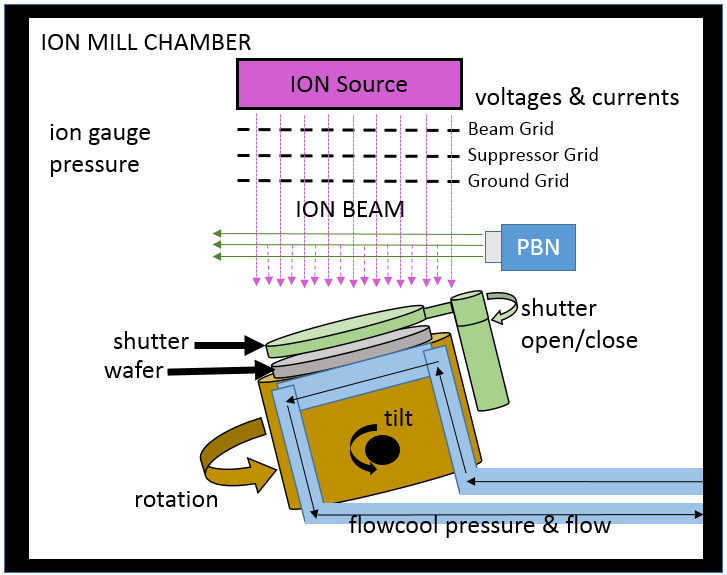
Figure 2. Wafer and ion mill etching process.
Objectives
The objective of this data challenge is to build a model from time series sensor data collected from various ion mill etching tools operating under various conditions and settings.
- Diagnose failures (i.e. detect and identify)
- Determine time remaining until next failure (i.e. predict remaining useful life)
Predictions of time-to-failure at a specific time should only use time-series data from current and past times. In other words, do not try to predict the point of failure first and then backtrack through time to determine time-to-failure predictions.
Data Description
The data for this challenge will be available at https://drive.google.com/open?id=15Jx9Scq9FqpIGn8jbAQB_lcHSXvIoPzb. The description of the settings / sensor data can be found in the Table below. The data has been anonymized so the units are not provided.
| ID# | Parameter Name | Type | Description |
|---|---|---|---|
| S1 | time | Numeric | time |
| S2 | Tool | Categorical | tool id |
| S3 | stage | Categorical | processing stage of wafer |
| S4 | Lot | Categorical | wafer id |
| S5 | runnum | Numeric | number of times tool has been run |
| S6 | recipe | Categorical | describes tool settings used to process wafer |
| S7 | recipe_step | Categorical | process step of a recipe |
| S8 | IONGAUGEPRESSURE | Numeric (Sensor) | pressure reading for the main process chamber when under vacuum |
| S9 | ETCHBEAMVOLTAGE | Numeric | voltage potential applied to the beam plate of the grid assembly |
| S10 | ETCHBEAMCURRENT | Numeric | ion current impacting the beam grid determining the amount of ions accelerated through the grid assembly to the wafer |
| S11 | ETCHSUPPRESSORVOLTAGE | Numeric | voltage potential applied to the suppressor plate of the grid assembly |
| S12 | ETCHSUPPRESSORCURRENT | Numeric (Sensor) | ion current impacting the suppressor grid plate |
| S13 | FLOWCOOLFLOWRATE | Numeric | rate of flow of helium through the flowcool circuit, controlled by mass flow controller |
| S14 | FLOWCOOLPRESSURE | Numeric (Sensor) | resulting helium pressure in the flowcool circuit |
| S15 | ETCHGASCHANNEL1READBACK | Numeric | rate of flow of argon into the source assembly in the vacuum chamber |
| S16 | ETCHPBNGASREADBACK | Numeric | rate of flow of argon into the PBN assembly in the chamber |
| S17 | FIXTURETILTANGLE | Numeric | wafer tilt angle setting |
| S18 | ROTATIONSPEED | Numeric | wafer rotation speed setting |
| S19 | ACTUALROTATIONANGLE | Numeric (Sensor) | measure wafer rotation angle |
| S20 | FIXTURESHUTTERPOSITION | Numeric | open / close shutter setting for wafer shielding |
| S21 | ETCHSOURCEUSAGE | Numeric | counter of use for the grid assembly consumable |
| S22 | ETCHAUXSOURCETIMER | Numeric | counter of the use for the chamber shields consumable |
| S23 | ETCHAUX2SOURCETIMER | Numeric | counter of the use for the chamber shields consumable |
| S24 | ACTUALSTEPDURATION | Numeric (Sensor) | measured time duration for a particular step |
The faults are marked in another file with corresponding time.
| ID# | Parameter Name | Type | Description |
|---|---|---|---|
| F1 | time | Numeric | time (e.g. seconds) |
| F2 | fault_name | Categorical | name of the particular class of fault that occurred at the specified time |
| F3 | stage | Categorical |
The time when the failure occurs is provided and is when the operator shuts down the machine for maintenance. This is what should be predicted. The actual start of the failure may occur much earlier than the provide failure time—this time is not provided.
The data is contained in a zip file. In this zip file, there are two folders, train and test. The train folder contains the training data used for modeling purposes. The test folder contains the test data that is to be used with your model to generate submissions of time-to-failure for the three different failure modes of interest: FlowCool Pressure Dropped Below Limit, Flowcool Pressure Too High Check Flowcool Pump, and Flowcool leak. The time where faults occur is found in the train/train_faults folder. Some time-to-failure examples are provided in the train/train_tff folder. There are ‘null’ values where faults do not occur in within a specified time horizon. The .csv files under the train folder represent the ‘sensor’ data that are used as predictors. Each of these files represent a separate ion milling tool.
Submissions
The scoring website (http://70.32.24.178:8080) is where submissions are to be sent for automated scoring on the test data set. Please contact nicholas.c.propes@seagate.com to create an account with the following information:
- Team Name:
- Team Members Real Names:
- Team Contact Email:
- Team Affiliation:
A submission consists of a single .zip file. This file is constructed by creating a folder called ‘test’ and placing the separate prediction files within. These prediction files should have the same filename and same number of rows as the corresponding ‘sensor’ data file. However, the prediction file should have the following columns: time, TTF_FlowCool Pressure Dropped Below Limit, TTF_Flowcool Pressure Too High Check Flowcool Pump, and TTF_Flowcool leak. There should be one prediction file per ‘sensor’ data file. Use the data in the test folder from the supplied data to create the 5 prediction files to place into your own test folder for submission. Only one submission per day per team is allowed.
Scoring
Scoring is computed by comparing the TTF submission with a ground truth TTF. Each TTF prediction has a subscore that is computed with the following rules:
| Ground Truth TTF (GT) | Submission TTF (SUB) | Score |
|---|---|---|
| Number | Number | exp(-0.001*GT)*abs(GT-SUB) |
| NaN | Number | exp(-0.001*SUB)*SUB |
| Number | NaN | exp(-0.001*GT)*GT |
| NaN | NaN | 0 |
The subscores for each prediction are summed and then divided by the total number of cells for each file. The file scores then then summed. A better score is one that is lower.
References